Quantitative v. Qualitative Info: Hint, it’s Rarely All One or the Other
When constructing a cross-modal correspondence learning through digital media, it is vital to setup a guiding framework for how information is systematically presented, otherwise one may be doomed to get lost in the multiplicitous minutia of varying information and sensory correspondence. Of the many forms of sense-based associations one can construct, for simplicity sake let us narrow it down to two visual effects, spatial dimensioning and color coding. When breaking down core academic content into codable digital programing, it is essential that we consider information as coming in two basic forms (various subcategories follow), those are quantitative verses qualitative data. While most instructors are well-versed in these terms, we will need to dig a little deeper to understand their application here.
Quantitative Data
We know that quantitative information is data that embodies or can be easily assigned a numeric value. This is critical to the concept of cross-modal presentation because any information that entails quantity can be placed on a scale of continuum and can thus be compared with other components of data which can be assessed to possess greater or lesser comparative value. This all suggests that direction can be easily inferred, enabling the coder and ultimately the presenter (teacher/instructor) to lay out components of information in a linear progression. If there are multiple quantifiable properties, then two or more axes can be employed on grids designed in formats such as the Cartesian Plane, delineating adjacent variables all of which can be numerically compared in progression. In academic instruction, mathematics is invariably a subject that lends itself to quantitative information in that it is predicated upon the operation of numbers, values, and related functions.
Qualitative Data
Qualitative data by contrast tends to be defined as information which is not easily assigned a numeric value. In part derived from the Latin term qualia, such information is considered subjective, experiential, and lived in nature, hence one cannot systematically partial out linear progression or hierarchical value. One cannot posit that the taste of an apple is bigger than that of an orange for example. Since qualitative value does not lend itself to measurement, placing qualitative components of data on a spatial continuum will invariably involve making arbitrary associative judgments which lack intrinsic logic. Colors by contrast are perceived by most people as qualitative in nature, hence they may correspond more in this instance. In academic instruction language in stark contrast to mathematics pertains far more qualitative information, after all, how would one place letters, words and sounds on a continuum with numeric progression?
But it’s Not All So Simple
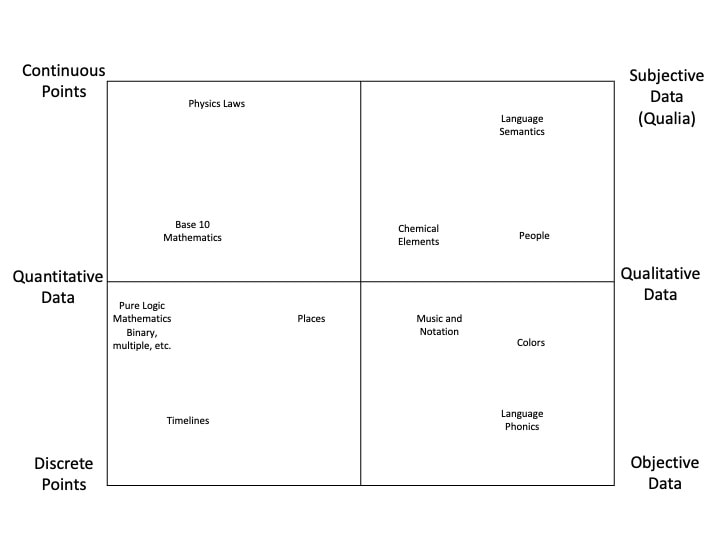
In theory, one could present all information as either quantitative or qualitative in nature, numeric or non-numeric, experiential of objectively logical. In the real world, there are few such absolutes, hence 100% quality verses 100% quantity is a highly reductive dichotomy. In practice, one could make the case that nearly every type of information embodies some elements of both quantitative and qualitative properties. Therefore, perhaps we should examine the very concept of quantitative and qualitative information as itself presenting a scalable continuum with gradation in between. On one end, we have pure quantity, exhibited by sheer objective non-experiential (no qualia) logic, on the other experiences that are in essence un-number-able. Some phenomena will tilt to the left side, some to the right, but few if any are completely to one end or the other.
One example on the quantitative end of the ledger is arithmetic. One would naturally argue, numbers are by nature quantitative, are they not? In many respects, yes, but number systems may not always possess pure logic. In western culture, many of us take it for granted that our math is based on digits, (base 10 number systems), after all we learn from early childhood about one’s place, ten’s place, hundred’s place, etc., and from they how to carry and borrow to solve basic arithmetic. But quantities don’t objectively exist in base 10, programmers are quick to discover this when they learn that binary is how computers crunch numbers, which essentially underscores all other functions they do. Anyone who has examined binary numbering systems quickly surmises that base 10 in not the most objectively logical number system, one grounded in core factoring and multiple structures would make more sense. The only reason human beings have adopted base 10 is our subjective experience of possessing ten fingers and toes, (hence the term ‘digits’ meaning fingers) otherwise our system would clearly be different, in turn shaping the patterns and structures of arithmetic entirely differently. Let’s examine that other end of the scale. Colors are purely qualitative are they not? Who can place a number on red or blue? Actually that’s not entirely true, for colors all represent wavelengths of light. A rainbow reflects the prismed breaking of white light into the full spectrum of colors. The lengths of each can be numbered, with red at roughly 740 to 625, orange at 625 to 590, yellow 590 to 565, green 565 to 520, blue 520 to 500, indigo 500 to 435, violet 435 to 380.
Likewise, sound pitch reflects sound wavelengths. In fact, there is a scientific quantitative explanation for why human have intuitively shapes musical notation systems around octave (eight note) ranges, it turns out have a distinctive percentile called the octave quantile which is consistent up and down the scale. No wonder why we have a kind of echoed pattern after each eight notes.
Why is This Significant? All this is stated to understand the processing of information. We know from extensive scientific research from researchers such as Julia Simner in her chronicled Oxford Handbook on Synesthesia that phenomenon such as synesthesia, where people’s senses are neurologically linked so that one or more senses trigger a separate sensory experience, (i.e. seeing sound or tasting color), that the deciphering of sensory experiences consistently entail logical correlations between properties, such as high pitch sounds appearing higher in the air and brighter than low pitched ones, or commonly used letters like A appearing in bright colors like red, as opposed to less common letters like Q being darker and less radiant. We know that there are a myriad of factors that guide such correspondence, ranging from semantic associations (high versus low, multiple meanings) to personal experiences to certain intrinsic properties that may even be shared by the animal kingdom. Her studies also provide ample evidence that such linking of sensory-information associations enhance engagement, memory and comprehension, such as her British study of colored-numbered blocks enabled students to retain numeric patterns more consistently than randomly colored number blocks. Hence, this tool of cross-modal correspondence holds great hopes of opening up a new frontier in teaching and learning, much like the educational television revolution of a half-century ago (which consciously or unconsciously utilized some of these same modalities then, through broadcast technology). The engaged audio-video production of core subjects such as reading and math (Sesame Street) reading (The Electric Company), math (Square One) and science (321 Contact) open world for a generation of young people and helped flatten the socioeconomic accessibility gap, for any child with a television could access such programming, regardless of their educational background. We can build software to not only emulates such goals but brings them to a new level, for the digital technology of today can bring it to scale while also enabling the material to be custom tailored and personalized, a program in every classroom essentially. What We Must Remember First In the age of Covid, nearly all educators have been forced to adopt digital learning in some form but that doesn’t necessarily make it quality learning. Many academics and instructors have lamented the poor use of digital media when applied to teaching. All too often existing suites fail to provide clear user-friendly modalities to instruction even for the technologically proficient educator, much less the not so digitally versed. Therefore, it is vital that such a program be crafted intelligently and systematically with the teacher and student in mind. One prerequisite to this understanding is the awareness that for the computer, or for that matter any digital platform, there is no such thing as qualitative information, no computer possesses experiences and feelings, there is no qualia on the digital plane. Computers, from their earliest days of vacuum tubes in the mid-1900s only crunch numbers, they simply do so highly efficiently as compared with human comprehension. We may perceive qualitative or experiential phenomena for our devises, (think video games and virtual reality) but all that is merely a simulation from an artificial digital representation, projected and then reinterpreted through human consumption. Likewise, for academic information to be coded into a computer, all of the quantitative and qualitative properties will need to marked and deciphered, for the latter will all need to be translated into the former, then ultimately translated back into qualitative data when utilized for instruction. In doing so, it will be important to keep track of all the properties embedded in each content area, which component lean toward quantitative versus qualitative data in the presentation and translation. Other Subject Matter While it is clear to see how mathematics veers towards quantitative and language qualitative (with some variation), other subjects may be more multifaceted and complex in their respective applications. In history for example, timelines and places can be quantifiable, whereas people, conditions and phenomena not so much. Therefore, let’s say we cover historic events with time in the X-axis going left to right (as it so often is in graphing form), and place on the Y-axis up to down. Conditions being more qualitative in nature can be represented by color, with green representing prosperity and brown depression (being that in agriculture green means fertile harvests and brown famine). Red can mean times of war and while times of peace (this all can be adjusted by the user of course). In science, let’s say biology, the nature of organs, systems and functions would seems closer to the qualitative end of the scale, others sciences such as chemistry and physics would appear to possess a higher degree of quantitative properties. The arts, be it music, fine art, dance etc. always contains many elements of dynamic creative work, while at the same time embodying mathematics, rhythmic patterns and geometry. Hence, this program may serve as a significant bridge between the educational world of STEM and that of the arts and humanities. Structure versus Flexibility One final point worthy of note in the creation of this program is the degree to which we must balance the formation of systemic measures of information with the ability to make adjustments on the part of teacher and student, so that its presentation and application can be suited to sensory correspondence and interpretations. With that in mind, I believe it wise to treat the highly quantitative aspects, presented by spatial layout and dimensioning as foundational and less prone to adjustment. Whereas the more color-coded qualitative components will be more open to adjusting. This is because the spatial-quantitative modes will be centered around embedded and innate logic, with datapoints explicitly presented left/right, up/down, front/back based upon greater or lesser value, or earlier or later time. By contrast, more qualitative information will be color-coded more arbitrarily, hence, there is less reason for it to be considered a bedrock principle. Consider as an analogy how seeds are planted in the soil in rows and columns. The structure of the soil represents the foundation for the plant’s growth. As they bud and sprout up, they grow more dynamic in nature, consider this the color-coded elements of the program. Having said that, none of this design should be completed written in stone. They needs to be at least a little flexibility in all components, especially considering the research showing variation in cross-model correspondence. Such elasticity in design must also be crafted carefully so that the foundation of the program remains intact, and the presenter need not him or herself be an expert coder to make adjustments. Rather, the end-user should be presented with a menu bar of options from which to choose specified associations.